The Karbon Analytics blog
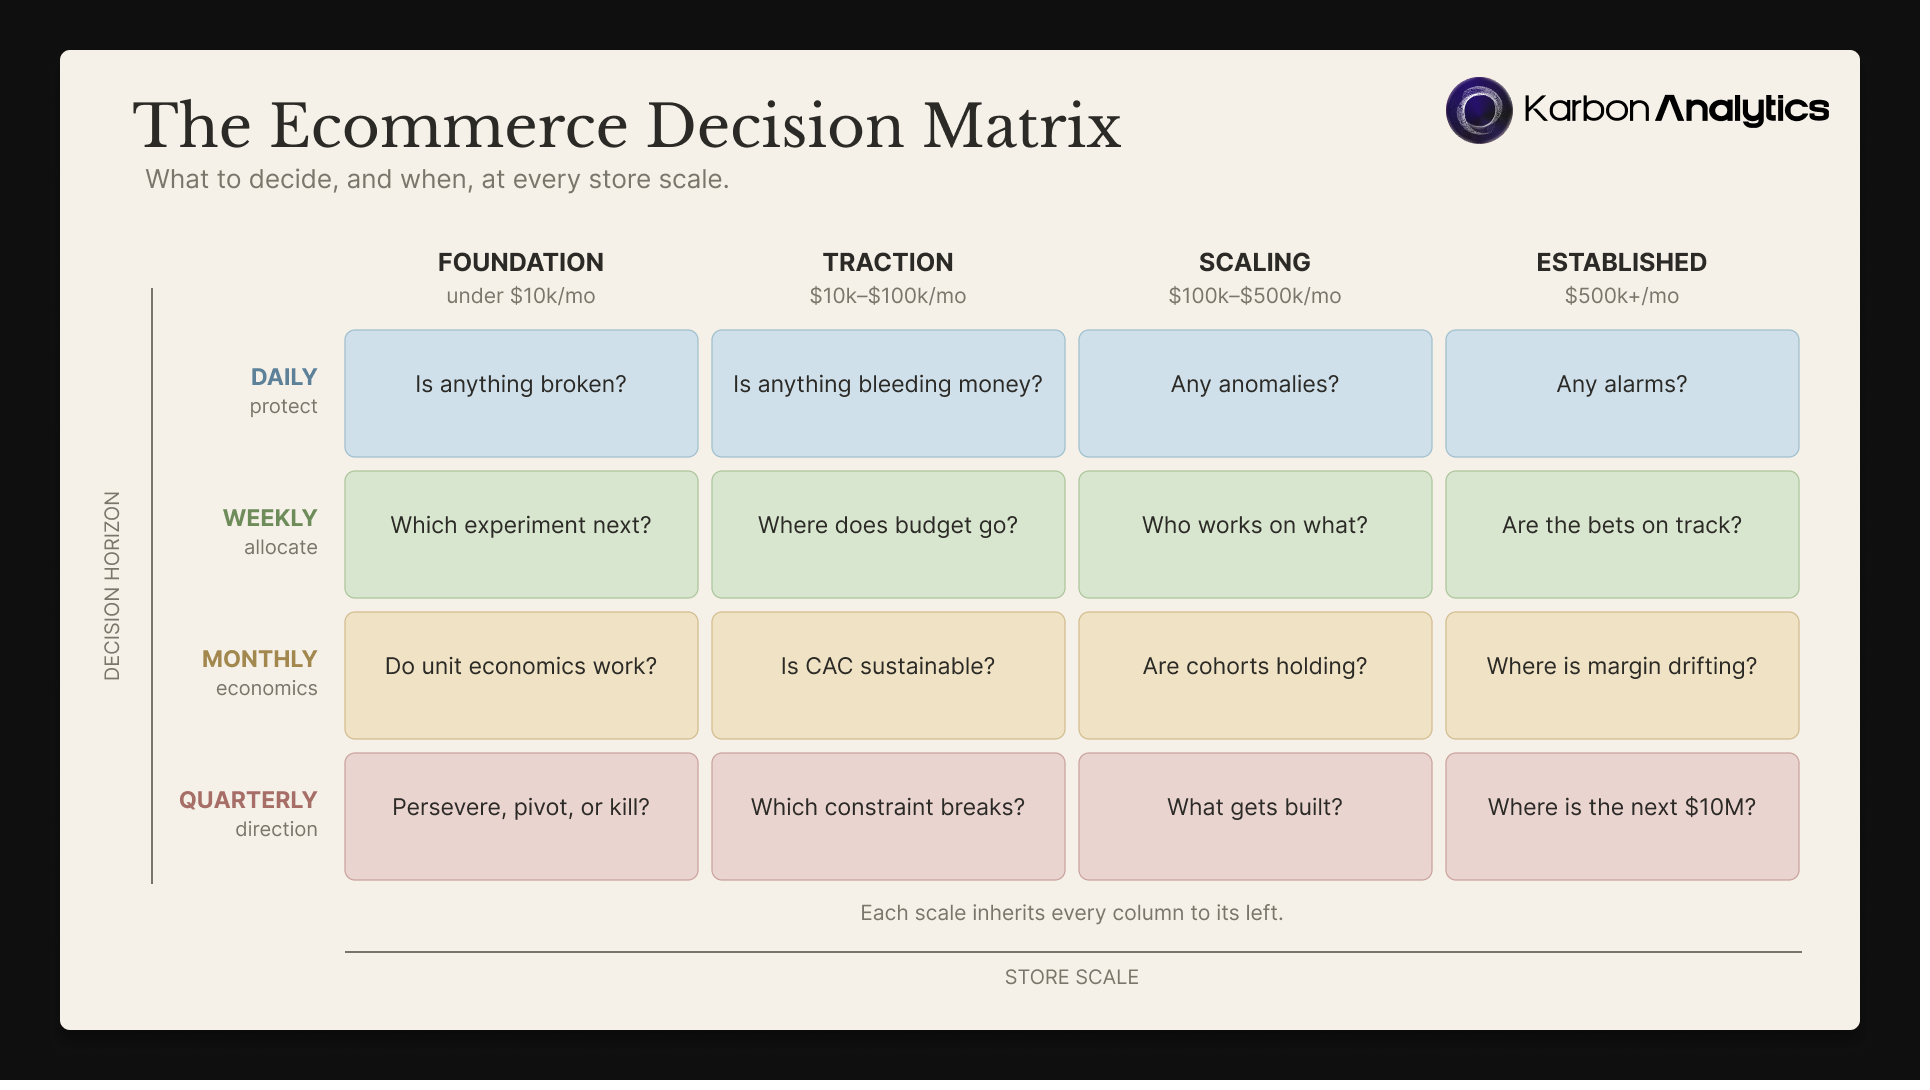
Top operators are not smarter than you. They decide on a cadence. This matrix maps the exact decisions to make daily, weekly, monthly, and quarterly, tuned to your store’s scale, so you stop reacting and start compounding.
All articles
Returning customers are cheaper to sell to, convert higher, and drive most of your profit. Here is how to measure repeat customers for a DTC Shopify brand, why they matter, and how to win them back.
AI assistants like ChatGPT, Perplexity, and Gemini are sending real buyers to Shopify stores, and most of it is invisible in your reports. Here is how to find AI traffic, track it in GA4 and Shopify, and why it undercounts.
The KPIs an ecommerce manager should actually track, organized by cadence: what to check daily, weekly, and monthly for a DTC Shopify store, and why the right metric at the wrong rhythm costs you.
Most Shopify stores go looking for a reporting setup in one of three situations, then pick one of five paths, from free templates to a full in-house data team. Here is the honest trade-off on each, and how to choose.
What counts as a good Shopify conversion rate in 2026? It depends first on how you define it. This guide covers session vs user vs checkout rate, then typical benchmarks by industry, device, and traffic source for DTC brands.
Customer LTV (lifetime value) is the total profit one customer generates over their whole relationship with your store. Learn the formula, a worked example, the LTV:CAC ratio, and how to raise it for a DTC Shopify brand.
Blended CAC is total sales and marketing spend divided by all new customers acquired, across every channel. Learn the formula, how it differs from paid CAC, and how to track it for a DTC Shopify brand.
Blended ROAS is total revenue divided by total ad spend across every channel. It is the ad number that cannot be inflated by attribution windows. Here is the formula, a worked example, and why it tells the truth when platform ROAS lies.
MER (marketing efficiency ratio) is total revenue divided by total marketing spend. Use the free MER calculator below, and learn the formula, worked examples, and what a good MER looks like for a Shopify brand.
Shopify’s new ChatGPT and Claude connectors let AI assistants query orders, update prices, and create products on your live store. Here is what they do, what they cannot do, and why operators should not let AI run unsupervised against production data.
See 15 real Shopify dashboard examples covering sales, marketing, customer LTV, inventory, profitability, and ad efficiency, each with the KPIs it tracks, who owns it, and how often to check it.
A practical framework for Shopify brands: which changes in revenue, ads, and traffic are real signals, how to rank them by impact, and how to turn a daily check-in into decisions, not another dashboard rabbit hole.
Most brands do not actually know which customers are loyal or profitable. Cohort analysis reveals who sticks, who churns, and who is worth scaling. Learn how to see true customer loyalty beyond your dashboard totals.
Meta says you made money. Shopify says you did not. Learn why the numbers never match, which metrics to trust, and how a unified data model gives you one source of truth.
Stop updating spreadsheets and get insights delivered automatically. No more Monday morning chaos. Learn how to automate your Shopify reports.
The complete 2026 guide to Shopify analytics dashboards: the 7 essential dashboard types, the KPIs that matter, real examples, and how to build a unified view across every channel.
Black Friday and Cyber Monday are the biggest revenue moments of the year. Solid analytics setup now means faster decisions, higher ROAS, and fewer firefights when traffic spikes.
Your top-selling products reveal customer preferences, market trends, inventory optimization opportunities, pricing strategy effectiveness, and potential for business growth.
A practical guide to the channels and tactics that most often drive profitable growth for online stores, with examples, benchmarks, and do's and don'ts.
Invoice proration in SaaS means you only pay for what you use. Learn how proration works when you upgrade, downgrade, or change your subscription mid-billing cycle.