Shopify Analytics 101: How to Build the Perfect Ecommerce Dashboard
TL;DR
- Default Shopify analytics tell you what happened inside your store, but miss everything that drove the result: ad spend, attribution, cross-channel revenue, and profit.
- A complete Shopify analytics stack needs seven dashboard types: sales, marketing, customer, inventory, profitability, marketing efficiency, and operations.
- The key KPIs that actually matter for $1M to $20M Shopify brands are blended ROAS (MER), new customer CPA, repeat purchase rate, contribution margin, and inventory weeks on hand.
- You have three real options for building this view: spreadsheets (free but expensive in time), BI tools (powerful but heavy to maintain), or a purpose-built ecommerce analytics platform.
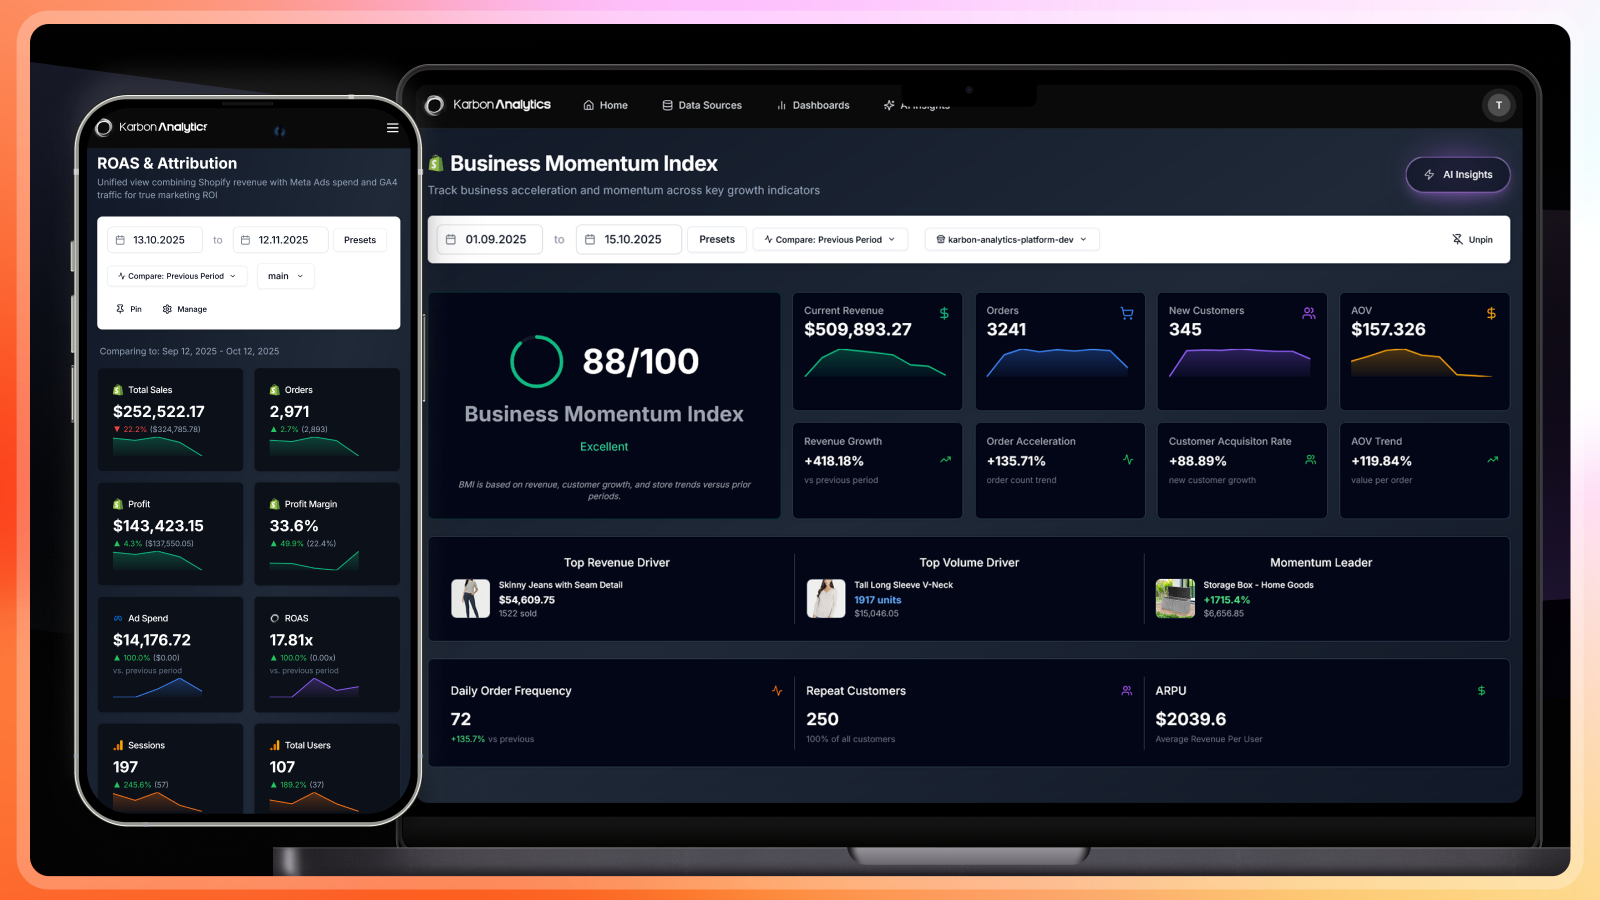
- Karbon Analytics ships pre-built Shopify dashboards across all seven categories on a unified data model that connects Shopify with Meta Ads, Google Ads, GA4, and Klaviyo.
Why Default Shopify Analytics Aren't Enough
Shopify's native analytics are excellent at telling you what happened inside your store. Orders, conversion rate, top products, sessions by source. Accurate within Shopify's data, fast, free.
The problem is what they leave out. Default Shopify reports cannot answer the questions a $1M to $20M store actually needs to answer every day:
- No ad spend. You see $10,000 in sales but not the $8,000 you spent to get them. Profitability is invisible.
- Last-click attribution only. Shopify credits the final touchpoint before purchase. Upper-funnel paid social and view-through influence are systematically underreported.
- No cross-channel reconciliation. Meta says one ROAS, Google says another, GA4 says a third. Shopify cannot reconcile these for you.
- No contribution margin or net profit. Revenue minus COGS minus shipping minus ad spend is the number that actually matters. Default Shopify reports stop at revenue.
- No leading indicators. Yesterday's revenue is a lagging indicator. Stockout risk, ad-efficiency drift, and cohort decay are leading indicators. Default Shopify reports show you what already happened.
A real Shopify analytics dashboard has to fill these gaps. The rest of this guide breaks down the seven dashboard types every serious Shopify operator needs, the KPIs that belong on each, and the three real paths to building this view.
The 7 Essential Shopify Dashboards
A "Shopify analytics dashboard" is not one dashboard. It is a stack of seven views, each answering a different operational question:
- Sales dashboard answers "Is the store running?"
- Marketing dashboard answers "Are the ads working?"
- Customer dashboard answers "Are we building loyalty?"
- Inventory dashboard answers "Are we about to stock out?"
- Profitability dashboard answers "Are we actually making money?"
- Marketing efficiency dashboard answers "Can we scale ad spend?"
- Operations dashboard answers "Is anything broken in fulfillment, refunds, or checkout?"
Each one is described below with the metrics that belong on it.
Sales Dashboard: Orders, AOV, Conversion
This is the daily pulse dashboard. Open it first thing every morning to confirm the store is operating normally.
- Revenue: Today, yesterday, week-to-date, month-to-date, year-to-date. With prior period comparison.
- Orders: Total orders by day, with year-over-year comparison.
- AOV (Average Order Value): Revenue divided by orders. Watch for sudden drops, which often signal heavy discounting.
- Conversion rate: Sessions to checkout to purchase. Watch the checkout step in particular for funnel friction.
- Net sales: Revenue minus refunds minus discounts. The number that hits your bank account.
Watch out for:
Time-zone drift. Shopify reports in your store's time zone, but if you cross-reference with ad platforms in a different time zone, your "yesterday" numbers will be hours off.
Marketing Dashboard: ROAS, MER, Channel Mix
The marketing dashboard answers "are our ads working" across every paid channel.
- Channel ROAS: Platform-reported ROAS for Meta, Google, TikTok, etc. Treat as directional, not absolute.
- Channel spend: Daily and weekly spend per channel.
- Cost per acquisition (CPA): Per channel and blended.
- New customer percentage: What share of orders came from first-time buyers? Watch for declines, which signal acquisition slowdowns.
- Channel mix shifts: Is one channel growing share faster than the others? This often signals over-reliance.
Channel ROAS by itself is a trap. Meta will claim 5x, Google will claim 5x, but the bank account does not lie. The marketing efficiency dashboard below is where the truth lives.
Customer Dashboard: LTV, Cohorts, Repeat Rate
The customer dashboard answers "are we building a real brand, or just renting attention?"
- Customer Lifetime Value (LTV): Total revenue per customer over their relationship with you.
- Repeat purchase rate: Share of customers who buy twice or more. The single best signal of product-market fit.
- Cohort retention: By acquisition month, how does revenue per customer hold up over the next 6 to 12 months?
- LTV:CAC ratio: Lifetime value divided by customer acquisition cost. Under 3:1 means growth is unprofitable. 3:1 to 5:1 is healthy. Over 5:1 means you are leaving growth on the table.
- Time between purchases: Useful for subscription, consumables, and replenishment brands.
Inventory Dashboard: Stockout Risk, Turnover
Inventory is where most Shopify brands quietly lose revenue. The default Shopify inventory view shows current stock. A real inventory dashboard shows risk.
- Stockout risk: SKUs likely to sell out within 7, 14, and 30 days at current velocity.
- Weeks on hand: Current inventory divided by weekly sales velocity, per SKU.
- Inventory turnover: COGS divided by average inventory value, annualized.
- Dead stock: SKUs with no sales in the last 30, 60, or 90 days. Capital tied up in products nobody wants.
- Negative inventory: Oversold SKUs that need urgent attention to avoid customer service incidents.
Profitability Dashboard: Contribution Margin, Net Profit
This is the dashboard that separates real operators from vanity-metric chasers. Revenue is a vanity metric. Contribution margin is the truth.
- Gross margin: Revenue minus COGS, as a percentage. Should be relatively stable.
- Contribution margin: Revenue minus COGS minus shipping minus ad spend. The actual dollar amount left over to cover everything else (rent, salaries, software, taxes).
- Net profit: Contribution margin minus all other operating expenses. The true bottom line.
- Profit per order: Net profit divided by orders. A surprisingly useful operational number.
If your contribution margin is negative on a paid campaign, you are paying customers to buy from you. This is fine briefly for testing but ruinous at scale.
Marketing Efficiency Dashboard: Blended ROAS, CPA
Channel-level ROAS lies to you. Marketing efficiency at the business level does not.
- Marketing Efficiency Ratio (MER), also called blended ROAS: Total store revenue divided by total ad spend across every channel. The single most important number for scaling decisions.
- New customer MER (sometimes called naMER): New customer revenue divided by ad spend. Strips out the inflating effect of returning customers.
- Customer Acquisition Cost (CAC): Ad spend divided by new customers acquired.
- Payback period: How many months until a new customer's LTV exceeds their CAC.
- Spend with zero return: Campaigns that spent money but produced no orders. Daily check.
Rule of thumb
If your blended ROAS (MER) stays above 3.0 with positive contribution margin, you can usually scale ad spend confidently. If it drops below 2.5 for more than a week, pause and diagnose before adding budget.
Operations Dashboard: Refunds, Fulfillment, Returns
The dashboard that catches problems before customers do.
- Refund rate: Refunded orders as a percentage of total orders. Watch the trend, not the daily number.
- Fulfillment backlog: Orders waiting longer than your SLA to ship.
- Checkout conversion drop: Sessions that started checkout but did not complete. Spikes signal payment or shipping friction.
- Cart abandonment rise: Adds to cart without checkout. Often points to pricing or trust issues.
- Failed payments: Authorization failures by payment method. Easy to miss until it costs you a meaningful share of revenue.
Real Shopify Dashboard Examples
What does a working set of these dashboards look like in practice? Three common patterns:
Pattern 1: The "Morning Brief" Layout (Solo Founder)
One screen. Five widgets. Designed to be glanced at over coffee in under two minutes:
- Yesterday's revenue, orders, and AOV with prior-period comparison.
- Yesterday's blended ROAS (MER).
- Stockout-risk count: how many SKUs at risk in the next 14 days.
- Refund rate trend (last 7 days vs. previous 7).
- Any active alerts (stockout, ROAS drop, refund spike, fulfillment backlog).
Pattern 2: The "Department Heads" Layout ($5M to $20M Operator)
One dashboard per function, each with 5 to 8 widgets:
- Sales dashboard for the CEO and ops lead.
- Marketing efficiency dashboard for the head of marketing.
- Customer dashboard (LTV, cohorts, retention) for retention and CRM leads.
- Inventory dashboard for ops and merchandising.
- Profitability dashboard for finance.
Pattern 3: The "Boardroom" Layout (Pre-Funding or Strategic Review)
One narrative dashboard showing the past quarter:
- Revenue and net sales trend with year-over-year comparison.
- MER trend with bands for "scaling zone," "neutral," and "compress."
- New customer cohort retention curves.
- Contribution margin per channel and per product category.
- Inventory turnover and capital efficiency.
How to Build Your Dashboard: 3 Real Options
Option 1: Spreadsheets (The Manual Path)
Export CSVs from Shopify, Meta Ads, Google Ads, and GA4 every morning. Paste into a master Google Sheet. Build pivot tables and formulas to calculate MER, contribution margin, and cohorts.
Pros: Free. Fully customizable. You understand every formula.
Cons: Takes 5 to 10 hours per week. Prone to copy-paste errors. Always stale by the time it is finished. No alerts when something breaks overnight. Cohort analysis in spreadsheets is genuinely painful.
Right for: Sub-$1M GMV stores, very early founders who want to understand the math from first principles.
Option 2: BI Tools (Looker Studio, Tableau, Metabase)
Connect Shopify, Meta Ads, Google Ads, and GA4 to a BI tool via paid connectors (Supermetrics, Funnel.io, Improvado) or build your own ETL into a warehouse like BigQuery.
Pros: Maximum flexibility. Real engineering-grade reporting. Scales to enterprise.
Cons: $500 to $5,000 per month in connector + warehouse + BI tool costs. Requires real technical skill or a hired analyst. Schema changes on the platforms regularly break pipelines. Months to set up, weeks to fix.
Right for: $20M+ brands with in-house data teams.
Option 3: Purpose-Built Ecommerce Analytics
Connect Shopify, Meta Ads, Google Ads, GA4, and Klaviyo to a platform built for ecommerce operators. Pre-built dashboards for all seven categories above ship on day one.
Pros: Connects in 60 seconds via OAuth. Dashboards work immediately. Cross-channel reconciliation handled inside the model. Daily alerts and email briefs out of the box.
Cons: Paid subscription. Less customizable than a BI tool.
Right for: $1M to $20M Shopify brands who need answers today, not next quarter.
Karbon Analytics sits in this category and ships pre-built dashboards across the seven types described above.
Common Shopify Dashboard Mistakes
- Trusting platform-reported ROAS alone. Meta says 5x, Google says 5x, your bank says you are losing money. Always cross-check with MER.
- Reporting gross revenue, not net sales. A 20 percent refund rate makes your headline revenue meaningless. Always net of refunds and discounts.
- 50 widgets, no actions. A dashboard with 50 charts is wallpaper. Five widgets that each have a clear action are a tool.
- Static dashboards with no alerts. You should not have to look at a dashboard to know something is broken. The system should tell you.
- Vanity metrics in board decks. Total revenue, total sessions, total followers. Use efficiency metrics instead: MER, LTV:CAC, contribution margin per channel.
- No cohort view. Without cohort retention you cannot tell whether your business is healthier than last year or just bigger.
- Mixing time zones. Shopify in store time zone, Meta in ad account time zone, your team in another. Yesterday becomes a four-hour-wide window.
How a Unified Data Model Changes the Picture
The seven dashboards above all sit on the same underlying data: Shopify orders, Meta and Google ad spend, GA4 sessions, Klaviyo flows. If that underlying data is reconciled once and reused everywhere, the dashboards agree. If it is reconciled separately for each report, they drift.
A unified data model ingests every source, normalizes them into a shared schema, and reconciles cross-platform differences (currencies, time zones, identities, refund handling) inside the model. Every dashboard, signal, and brief then reads from the same reconciled view.
Karbon Analytics is built on this approach. Connect Shopify, Meta Ads, Google Ads, GA4, and Klaviyo, and the seven dashboards above are live the same day. Daily Signals watches your store and ad accounts overnight and emails you when a revenue cliff, ROAS drop, stockout risk, or refund spike happens, so you do not have to live in the dashboards to know what is going on.
Start a free trial of Karbon Analytics and your full Shopify analytics dashboard stack is live in your first session.
Keep reading